Debug printf via STM32 SWO can be very valuable in tracking application flow and debugging applications that have to run in the long term. You can always log printf based debug logs via SWO or UART and review them later to ensure that your program is functioning properly.
In this note, we go through the process of setting up STM32 CubeIDE to display ITM or SWO debug logs. Note that this applies to CubeIDE and may vary across different IDEs like Keil uVision and IAR. Depending on the IDE, you may have to enable things elsewhere or just do it differently.
Enable SWO Debug Output in STM32 CubeMX
SWO logs can be viewed within CubeIDE (which is built based on Eclipse). To set up the ITM Data Console, you need to do the following:
- Open Run > Debug Configurations
In the active debug configuration, under the Debugger tab, enable Serial Wire Viewer (SWV). - Make the ITM log terminal visible by going to
Window > Show View > SWV > SWV ITM Data Console - Find SWV settings and enable ITM Stimulus Port 0.
- Click the red “record” or Start Trace button whenever you want the trace terminal to show you logs.
Add "putchar" Function Code in syscalls.c for SWO printf
Any printf function calls you make will ultimately use a “print character” function that writes to any hardware peripheral where you desire the printf data output to go to.
This printf output destination can be UART, SWO debug output, a flash storage device, or any combination of peripherals like that. Here, we add a snippet necessary to direct characters towards the SWO terminal.
In the user code section of main.c file, you should paste this function. Also, make sure syscalls.c is generated for your project.
int __io_putchar(int ch)
{
 // Write character to ITM ch.0
 ITM_SendChar(ch);
 return(ch);
}
Write a Debug printf Test Program
A simple FreeRTOS task or the main() function can be used to call a printf() function and confirm the working of the SWO debug output and whether it is visible in the STM32 CubeIDE.
For FreeRTOS, for example, a task like this can be set up.
/**
* @brief Function implementing the defaultTask thread.
* @param argument: Not used
* @retval None
*/
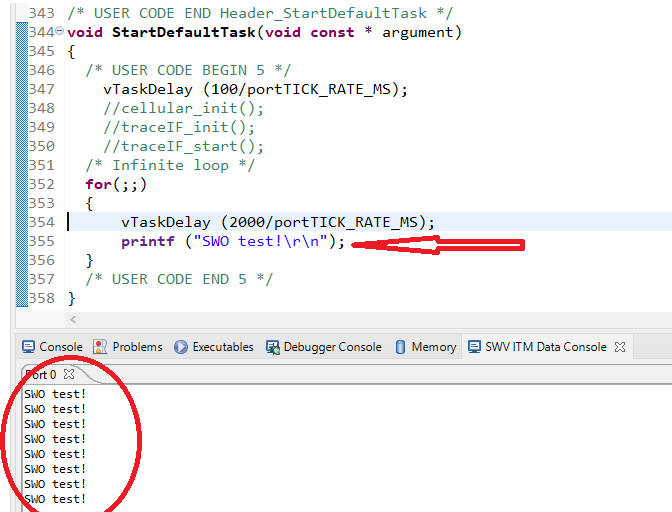
void StartDefaultTask(void const * argument)
{
/* USER CODE BEGIN 5 */
vTaskDelay (100/portTICK_RATE_MS);
/* Infinite loop */
for(;;)
{
vTaskDelay (2000/portTICK_RATE_MS);
printf ("SWO test!\r\n");
}
/* USER CODE END 5 */
}
Test SWO Debug Output
You can test the SWO printf output by making a printf call. For example, here a printf function is called every 2 seconds from the default FreeRTOS task. The printf is called in an infinite loop and you can see the debug output printed on the SWV ITM console.
Feel free to ask away via the Quick Contact form in the sidebar, or leave a comment below.
Change Log
- Initial Release: 19 September 2021
References
- Reference 1: ST Micro Debug Toolbox Application Note – AN4989