Measurement Characteristics
The following table lists the acoustic characteristics of the PCBA-DBM-r3 module at an ambient temperature of 25°C and non-condensing humidity of 90% RH or less.
| Parameter | Value | Unit |
| Sampling Rate | 16.00 | kHz |
| Reading Update Rate | 33.3 | Hz |
| Accuracy @1 kHz, 94 dB SPL | ±2 | dB SPL |
| Resolution | 1 | dB SPL |
| Averaging Logic | EMA | – |
| Parameter | Min | Typ | Max | Unit |
| Frequency Range | 20 | – | 8000 | Hz |
| Measurement Range (1% linearity) | 35 | – | 116 | dBA SPL |
| Averaging (EMA) Time Const | 10 | – | 10,000 | ms |
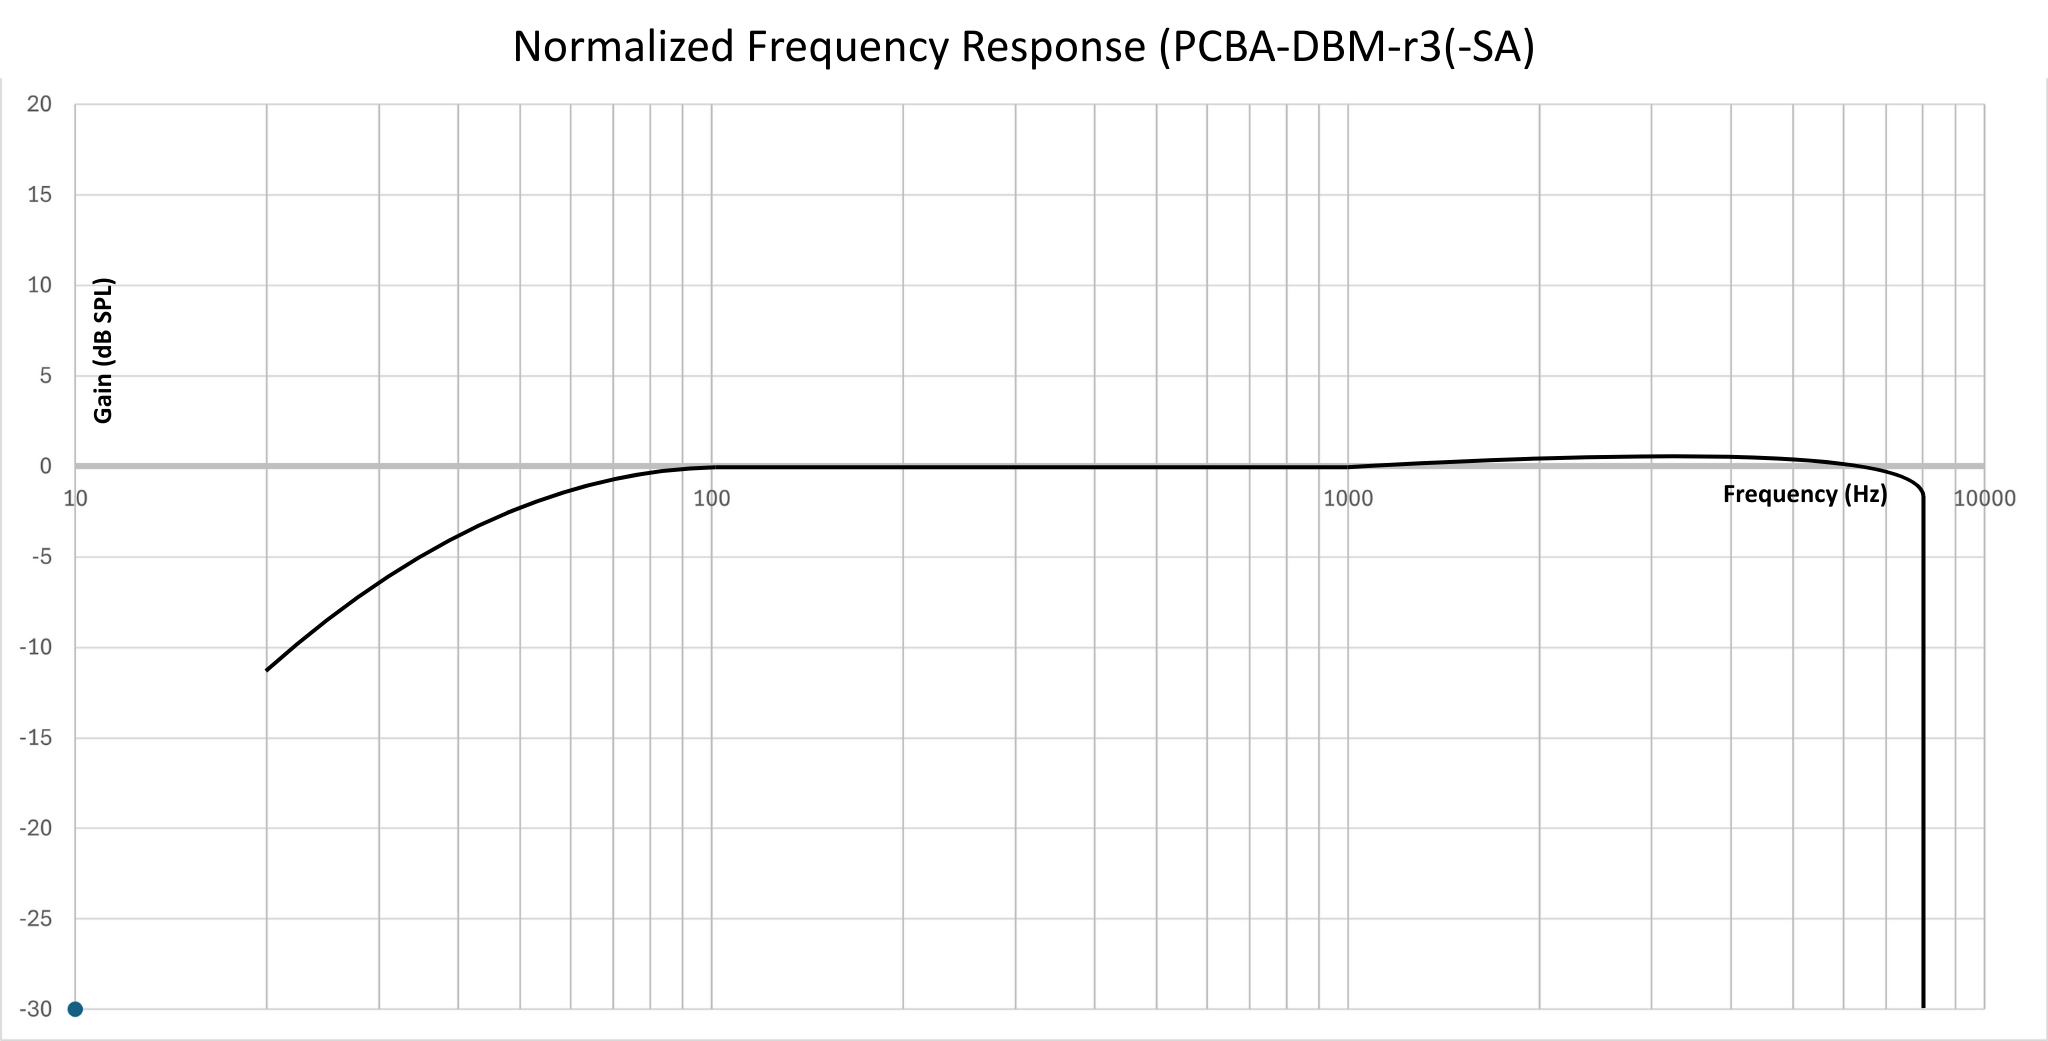
Frequency Response
The PCBA-DBM-r3 displays a flat frequency response in the audio frequency range that contributes most to ambient noise level measurements – 100 Hz to 2 kHz.
Frequency response of the sound level sensor module normalized to 0 dB at 1 kHz is shown below.
Time Averaging Logic
The time-averaging logic used by the PCBA-DBM-r3 is an implementation of the commonly used EMA (exponential moving average) algorithm. The PCBA-DBM-r3 uses the decibel reading values in dB SPL to calculate the moving average. This smooths out decibel readings over time and can aid with rejecting small spikes of loud noise.
Mathematically, to calculate the EMA of a stream of sound level values in dB SPL, the module outputs
yt=αxt+(1−α)yt-1
➤ where yt is the new decibel reading,
➤ xt is the current instantaneous dB SPL value calculated once every 30 ms,
➤ yt-1 is the older decibel reading,
➤ α is the time constant calculated by using the set 16-bit Tavg value in milliseconds (using registers Tavg_H:Tavg_L).
α=1−e−Δt/T
where Δt = 30 ms for the PCBA-DBM-r3,
T = Tavg in milliseconds
⚠️ IMPORTANT
Note that the EMA logic used in the PCBA-DBM-r3 uses the decibel readings in dB SPL for averaging, and not the absolute energy level values from which a decibel reading is derived.
Therefore, the PCBA-DBM-r3 time weighting logic does NOT comply with IEC-61672 guidelines.
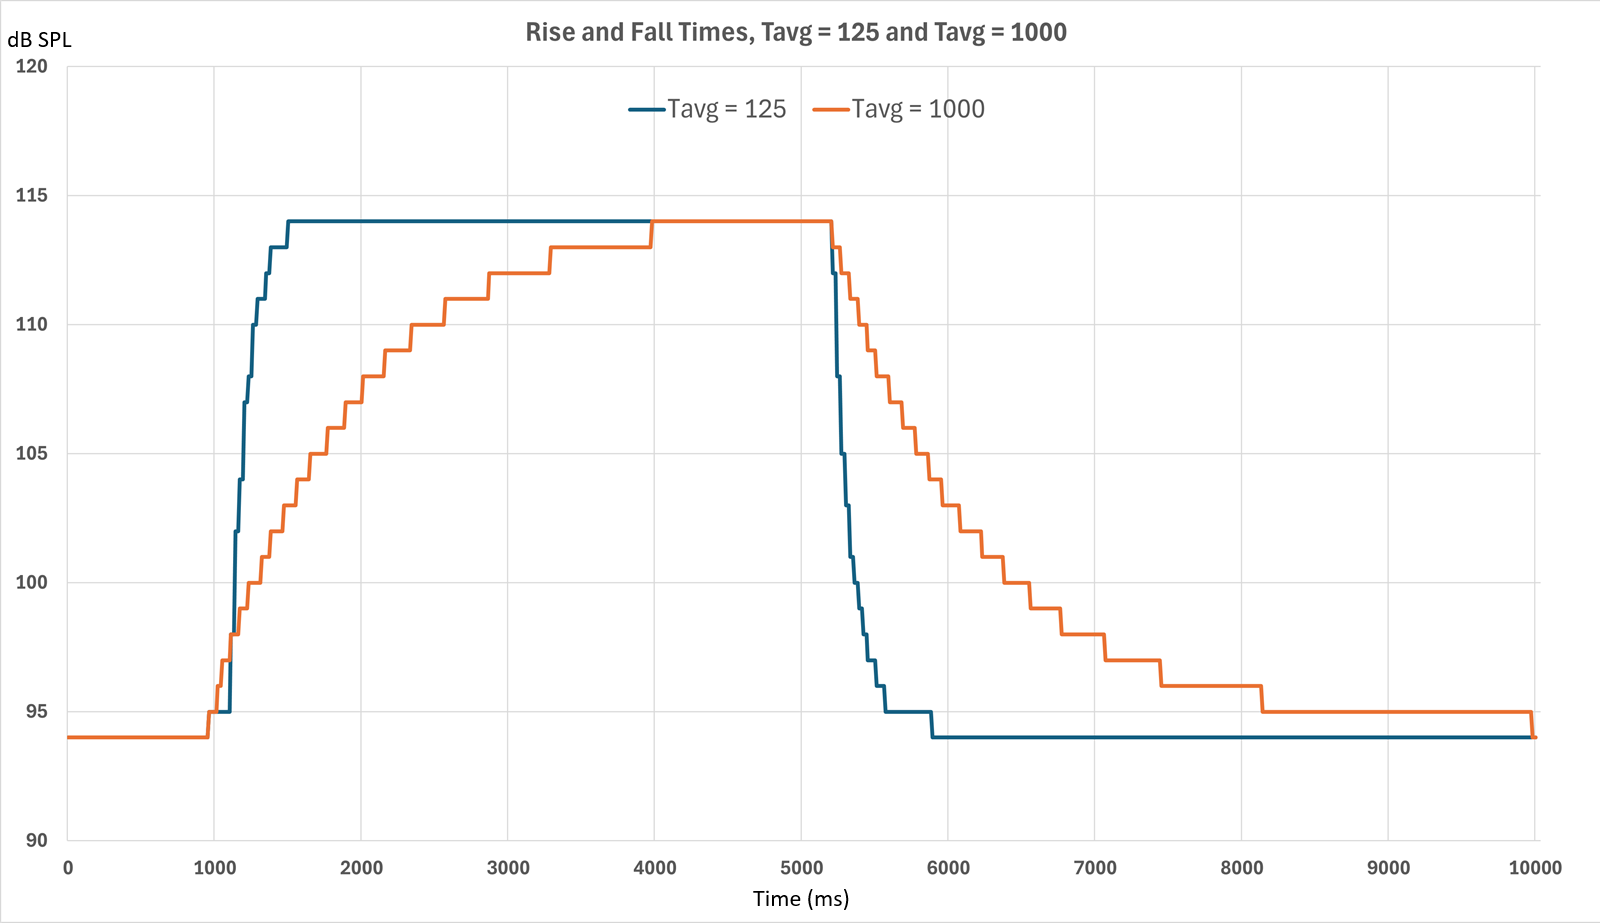
Here is a Sound Level (dB SPL) vs Time (ms) plot comparing the rise and fall times when Tavg = 125 and Tavg = 1000 are used. This plot is based on actual values read from the sensor.
Revision History
➤ September 12, 2025
– Initial release